Revenue and Performance Analytics
Dashboard
Revenue
Revenue dashboards provide insight into your revenue from Scheduled Orders.
- What's your total revenue from processed Scheduled Orders?
- How much revenue can you expect this month?
- How many Scheduled Orders processed in October?
- How much revenue did you make last month?

Revenue Dashboards
Processing Metrics
The Processing Metrics dashboard provides insight into your processing performance.
- Why are your Scheduled Orders failing (error codes counts)?
- How many are failing versus processing successfully?
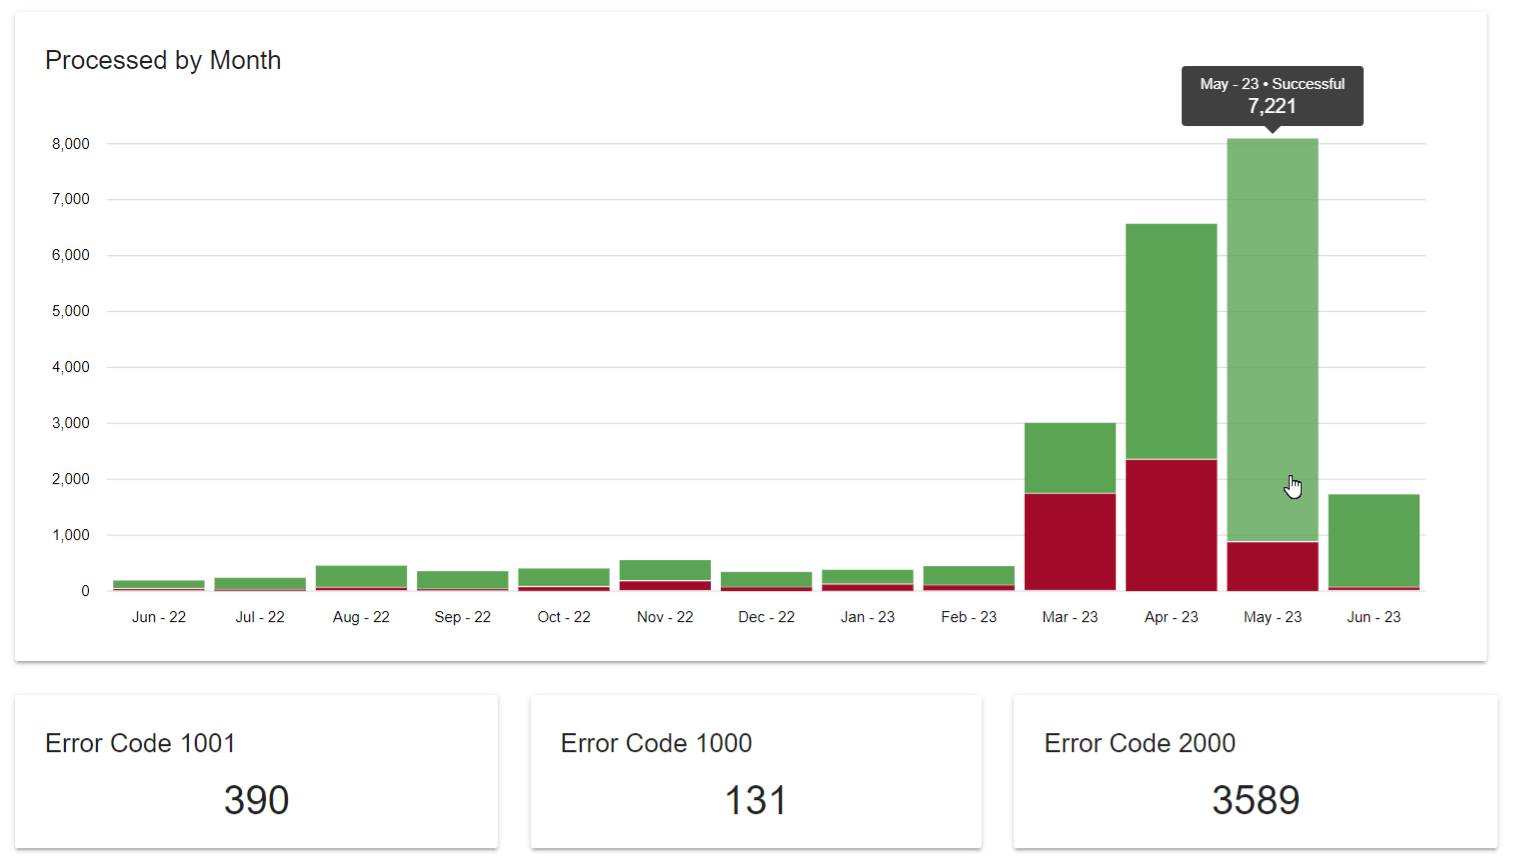
Processing and Error Code Reporting
Understanding the Results
Understanding your site processing trends can help you maximize the effectiveness of your Autoship Cloud integration. For example:
- If you have many Scheduled Orders failing due to the error "No Items To Ship", you may want to review your inventory management or your product availability processes.
- If you have many Scheduled Orders failing due to "Payment Failed", you can review how you are informing customers of failed payments (customer notifications) and see if you can recover these failed payments to complete processing.
Reports
To review your revenue and performance in greater detail, you can review your Scheduled Orders Metric Report.
- What is the average cycle count of your Scheduled Orders?
- What percentage of Scheduled Orders are Deleted?
- What is the most popular frequency?
- Has the value of Scheduled Orders increased over time?
Example Excel Chart using the Scheduled Orders Metric Report

Scheduled Order Status by Percentage (Excel chart)
Example Excel Chart using the Scheduled Orders Metric Report

Frequency Distribution (Excel chart)
Example Excel Chart using the Scheduled Orders Metric Report
.jpeg")
Total Lifetime Value by Created Date (Excel chart)
Understanding the Results
The examples outlined provide insight into your Autoship Cloud integration's performance and revenue.
- In the example Excel Chart "Scheduled Order Status by Percentage", you can see that very few Scheduled Orders are Deleted.
- The popularity of one frequency over others (as shown in the "Frequency Distribution" Excel chart) can be used to make marketing campaigns more effective.
- There is a positive trend in the lifetime value of Scheduled Orders created in the last few months as shown in the "Lifetime Value by Created Date" Excel chart. This means that the total revenue from Scheduled Order processing has increased.
Updated 2 months ago