Introduction to Dashboard Reports
The QPilot Site Dashboard is accessible from QPilot Merchant Center > Dashboard (from the three-dot action menu) and is designed to give you insights into your Autoship program's performance and key metrics. This dashboard enables merchants to optimize their Autoship program and monitor Scheduled Orders.
Understanding the Dashboard View
Revenue Reporting
This is the first section of your dashboard and can be filtered by the current week or month.
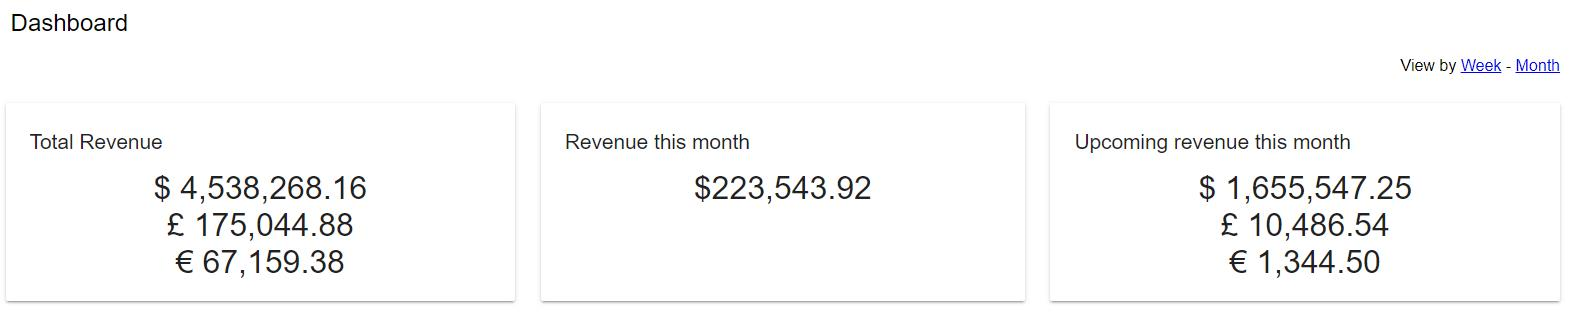
Revenue Reporting
- Total Revenue
- This reflects the total revenue from Scheduled Order processing for all time.
- The total revenue is segmented by currency as shown above.
- Revenue this Month/Week
- The total revenue from Successful Scheduled Order Processing within the current period.
- Upcoming Revenue this Month/Week
- Includes the total value (Scheduled Order subtotal) of all Active Scheduled Orders with a Next Occurrence Date from the current date to the end of the current month.
Filtering Revenue MetricsYou can filter the total revenue and upcoming revenue metrics by either Week or Month.
- The Week filter is for the current week of the current month.
- The Month filter starts on the first day of the month and ends on the last day of the month.
Scheduled Orders & Revenue
This line graph breaks down your total revenue and count from Scheduled Order processing within that month. If your site processes Scheduled Orders in multiple currencies, then each line represents the total revenue for each currency.
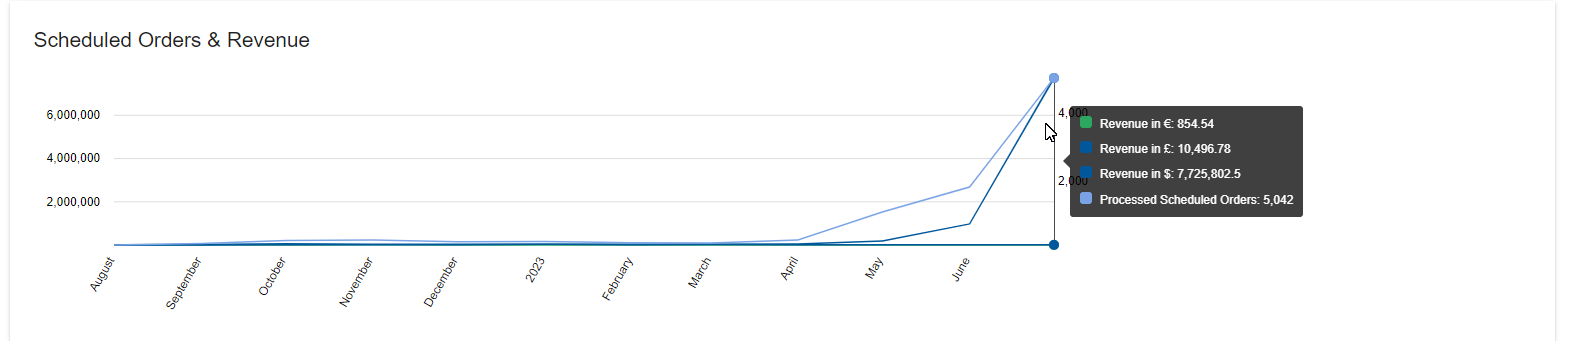
Scheduled Orders & Revenue Report
- Revenue
- This reflects the total revenue from Scheduled Order processing within that month.
- Processed Scheduled Orders
- The total count of Scheduled Order processing cycles within that month, regardless of processing status.
Note: The left-sided y-axis represents the revenue total whereas the right-handed y-axis represents the processed Scheduled Order total.
Scheduled Orders
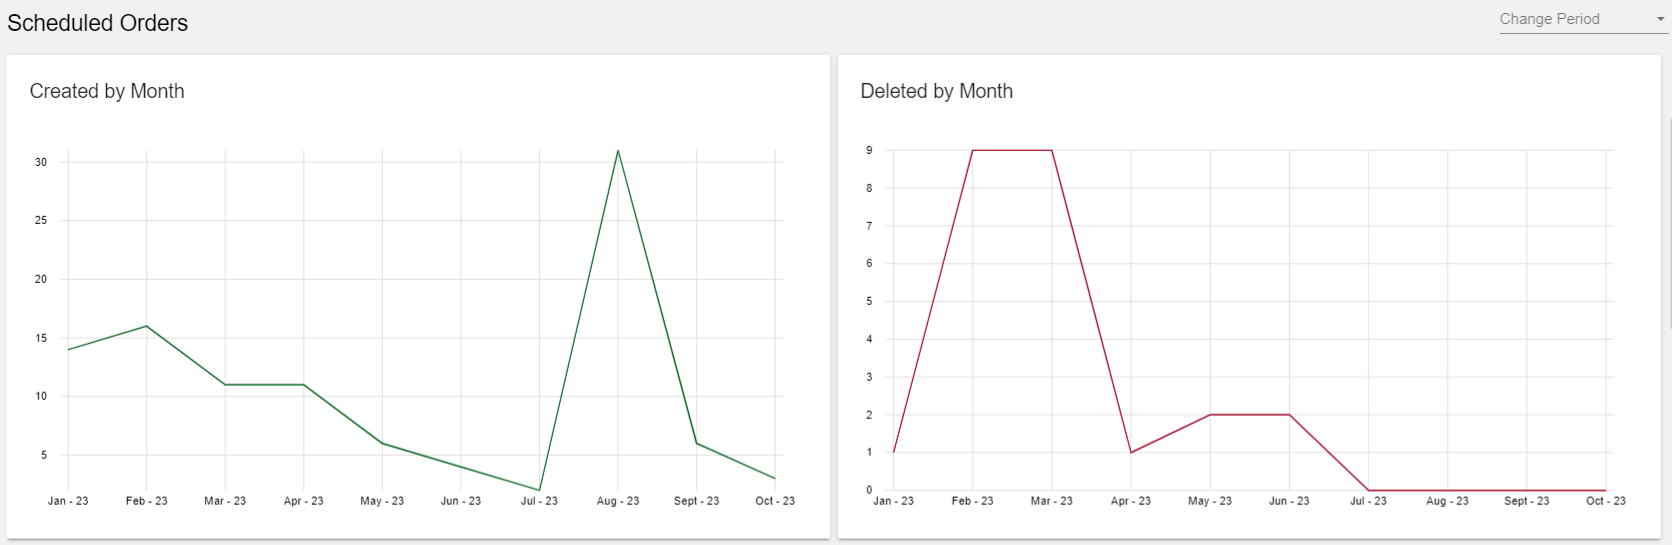
Scheduled Order Creation and Deleted Counts
- Created within Month
- Count of Scheduled Orders that were created within that month.
- Deleted within Month
- Count of Scheduled Orders that were deleted within that month.
Scheduled Orders Processing
Scheduled Order Processing Metrics charts reveal trends in retention and the value of processing Scheduled Orders month-over-month.
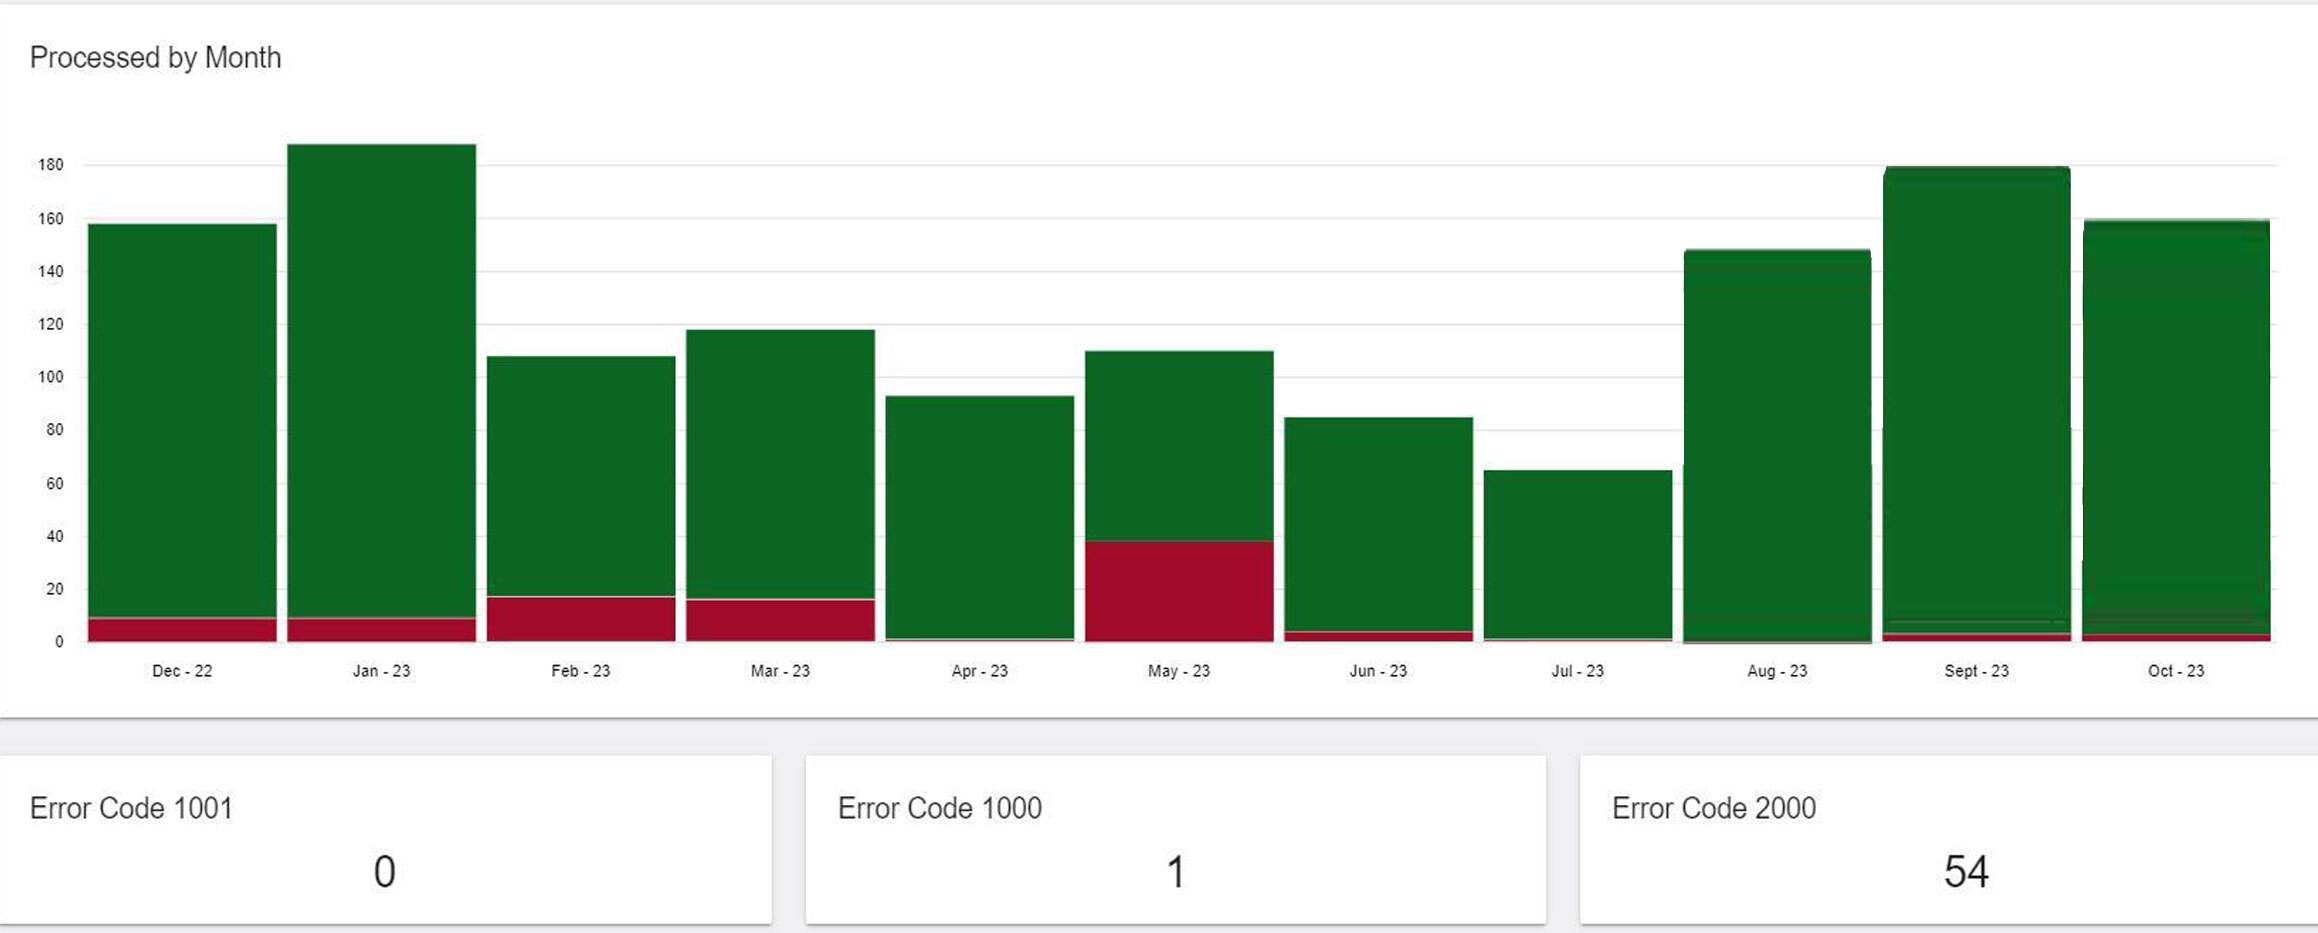
Processed By Month
- This bar chart provides insight into your total processing each month as well as your successful versus failed processing.
- Green represents the total number of Scheduled Orders processed successfully within that month.
- Red represents the total number of Scheduled Orders that failed to process successfully within that month.
- Directly below you will see a breakdown of the three most common Scheduled Order failure reasons. The value shown for each error shows the total count of Scheduled Orders affected by that error code for all time.
Understanding processing errors and how to manage them:What if my failed processing count went up? What should we do about these failures? Learn more about how to manage failed Scheduled Orders here: Managing Scheduled Orders
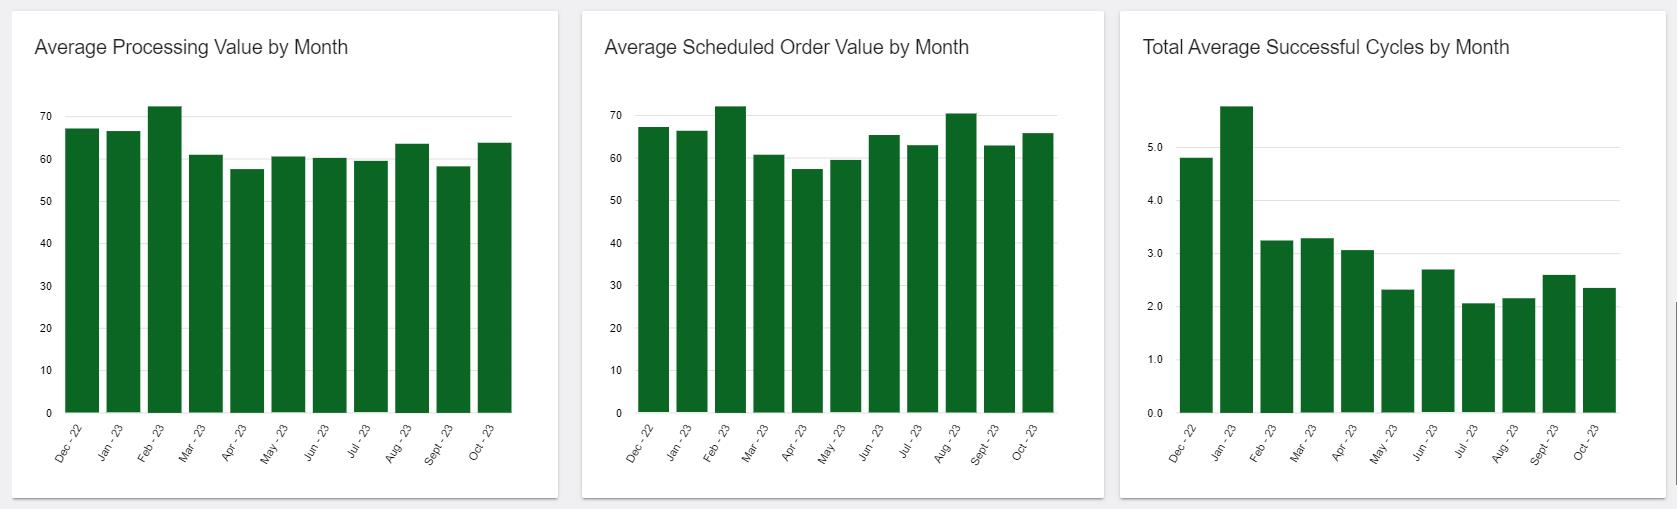
Average Processing Value By Month
- The average total charged (after coupon discounts, added shipping costs, and taxes) for all successful processing cycles within the given month.
Average Scheduled Order Value by Month (AOV) (also known as Average Order Value)
- The average value of the Scheduled Order subtotal (before any coupon discounts, added shipping costs, and taxes are applied) for all successful processing cycles within the given month.
Total Average Successful Cycles by Month
- The average count of successful processing cycles per month.
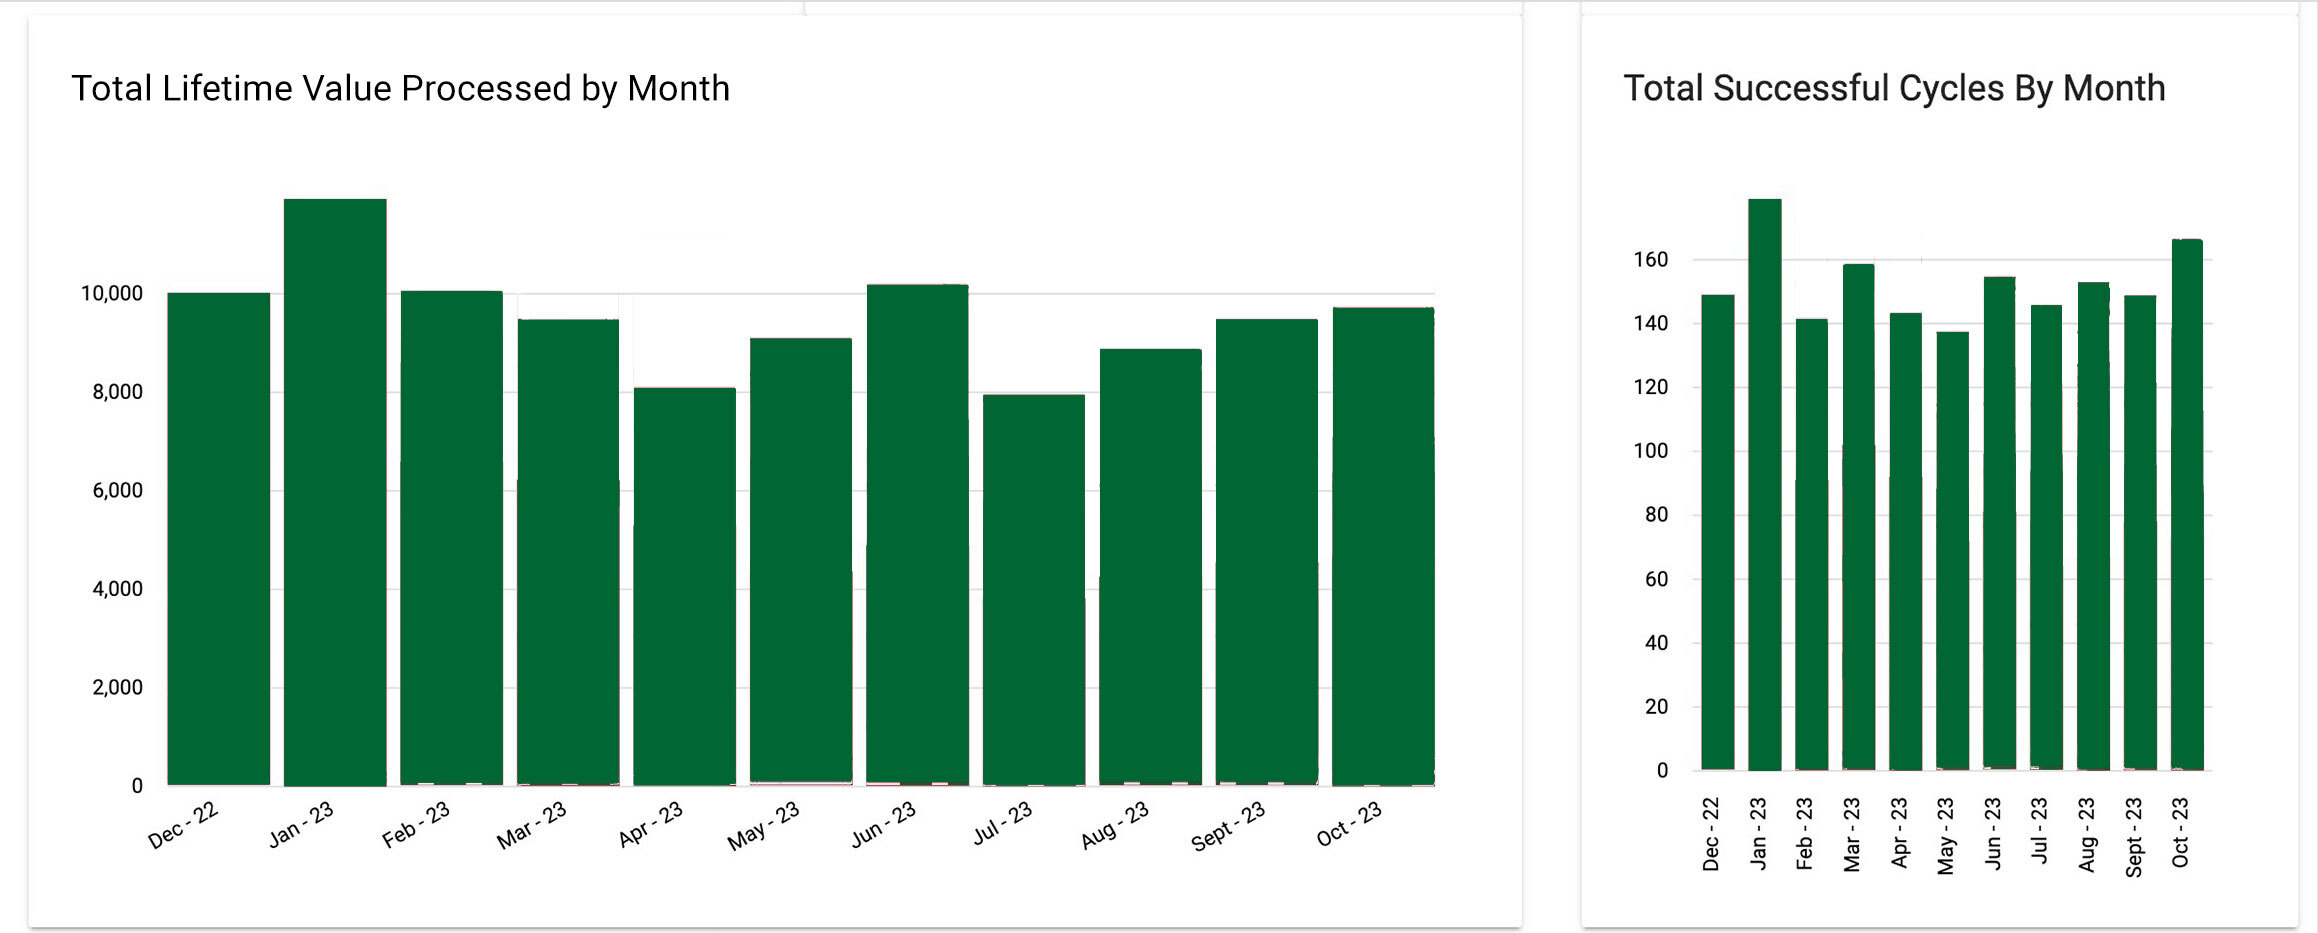
Total Lifetime Value Processed by Month
- The total Lifetime Value of all Scheduled Orders that were processed within the given month.
- Important: Changes in Total Lifetime Value month to month do not necessarily reflect changes to your monthly revenue. For example, not all Scheduled Orders for your site are processed every month.
Total Successful Cycles By Month
- The total count of Scheduled Orders that were successfully processed within the given month. If a Scheduled Order is processed more than once, each processing cycle within the given month is counted.
Protip!If you process Scheduled Order payments with more than one currency, you'll see each currency represented in your Scheduled Order processing metrics.
Recently Processed (Past 7 Days)
This report gives you a summary of the processing activity for your site for the last 7 days sorted by the most recently processed Scheduled Orders.
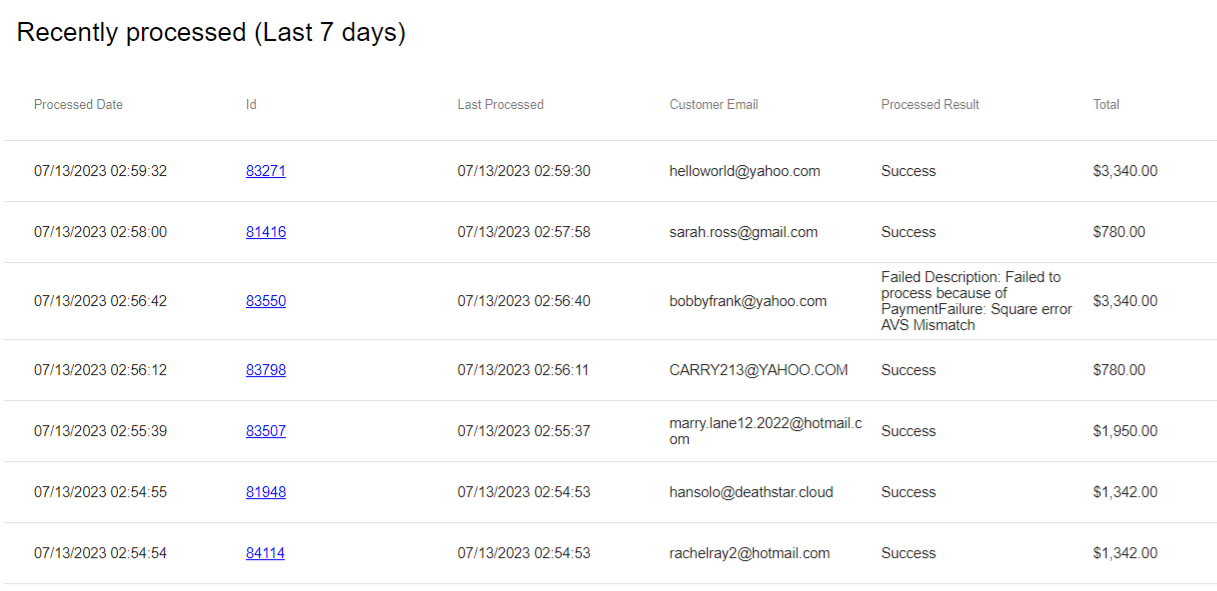
Recent Processing Report
Recent Processing Report Fields
- Processed Date
- Date and time when the processing event occurred.
- Id
- The ID of the Scheduled Order.
- Select the ID to edit the Scheduled Order.
Protip!You can click on the Scheduled Order Id to quickly view/edit that Scheduled Order. This can come in handy when recovering failed Scheduled Orders! Learn more about Managing Scheduled Orders here.
- Last Processed
- Date and time that the last processing event occurred.
- Note: this can be different than the Event Date when a Scheduled Order is processed multiple
times. For example, a Scheduled Order fails to process at 4:00am and then is retried and
processed successfully at 10:00am the same day. This will result in 2 events: one for the failed
processing event and one for the successful processing event. In this example, the failed processing event will show an Event Date of 4:00am and a Last Processed of 10:00am.
- Customer Email
- The email of the customer that the Scheduled Order belongs to.
- Processed Result
- The status of the Scheduled Order that resulted from attempting to process.
- Success or Failed are the results displayed.
- Failed results will include additional details to describe the failure reason.
- Total
- The total value of the Scheduled Order at the time it was processed.
- Processing Logs
- Launches the Scheduled Order's most recent Processing Logs modal.
Updated 2 months ago