Customer Turnover and Analysis
Dashboard
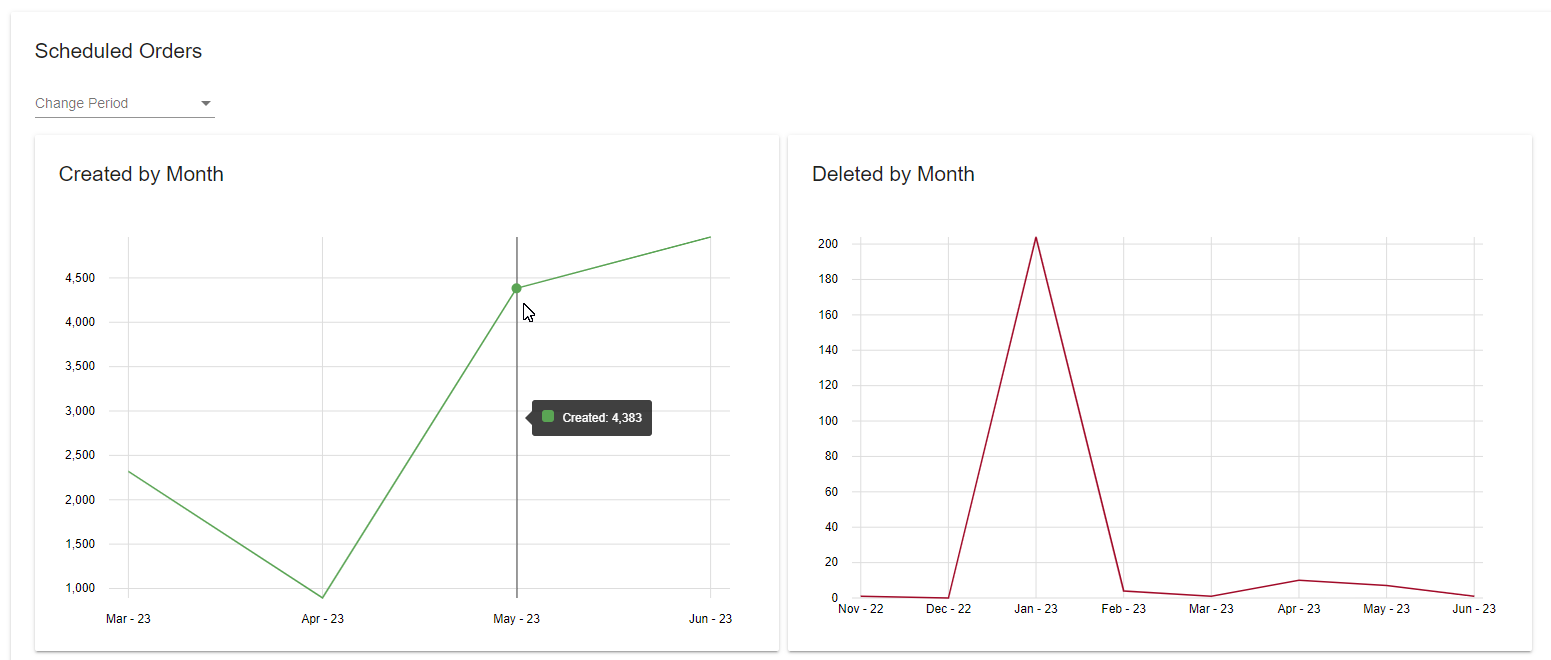
Created and Deleted Scheduled Orders
The created and deleted Scheduled Orders dashboard provides great insight into your Autoship integration by showing how many new Scheduled Orders have been created or how many have been deleted within a certain month.
Scheduled Order Performance Reporting
Understanding the Results
The dashboards shown above provide insight into customers' trends and behaviors.
- Created versus Deleted Scheduled Orders allow you to see Customer Churn
- Newly Created Scheduled Orders provides insight into how many new customers are creating Scheduled Orders. This can be very useful when reviewing the results of a marketing campaign.
Reports
Customer Metric Report
The Customer Metric report can provide insight into your customer's behavior.
- What is the distribution of cycle counts for your customer's lifetime value?
- How many Scheduled Orders do your customers create?
- What is the total and average cycle count?
- Who are your most loyal customers?
Example Excel Chart using the Customer Metric Report

Average Lifetime Value ($) by Cycle Count (Excel chart)
Example Excel Chart using the Customer Metric Report

Active Scheduled Order's By Customer (Excel Chart)
Example Excel Chart using the Customer Metric Report

Cycle Counts (Excel chart)
Scheduled Order Metrics
Scheduled Order Metric reports allow you to study your site performance and customer behaviors.
- At what cycle count are Scheduled Orders Deleted (Customer turnover)?
- How many Scheduled Orders are Deleted before they ever processing?
Example Excel Chart using the Scheduled Orders Metric Report

Deleted Scheduled Order Cycle Count (Excel chart)
Understanding the Results
The reports and examples outlined above allow you to glean insights into your customer's behavior.
- For example, the Excel chart "Average Lifetime Value ($) by Cycle Count" shows that the average lifetime value increases as the cycle count increases. This indicates that customers value your Autoship program.
- The Chart "Active Scheduled Order's By Customer" shows that some customers have multiple Scheduled Orders. This can indicate the customer has multiple shipping addresses or has products on varied Schedules.
- The chart "Cycle Counts" shows that 72% of Scheduled Orders have processed over 10 times.
- On the other hand, the Excel chart "Deleted Scheduled Order Cycle Count " shows most Scheduled Order deletions occur early on (before the 10th cycle).
- A merchant can combat this by providing more incentives (cycle-based coupons or free shipping for example) to keep the customer engaged.
Updated 2 months ago