Churn Analytics
Churn analytics provide powerful insights into your Scheduled Order retention and customer churn overtime.
Learn more about understanding churn analytics, utilizing this data, and more here: Understanding Churn Reports
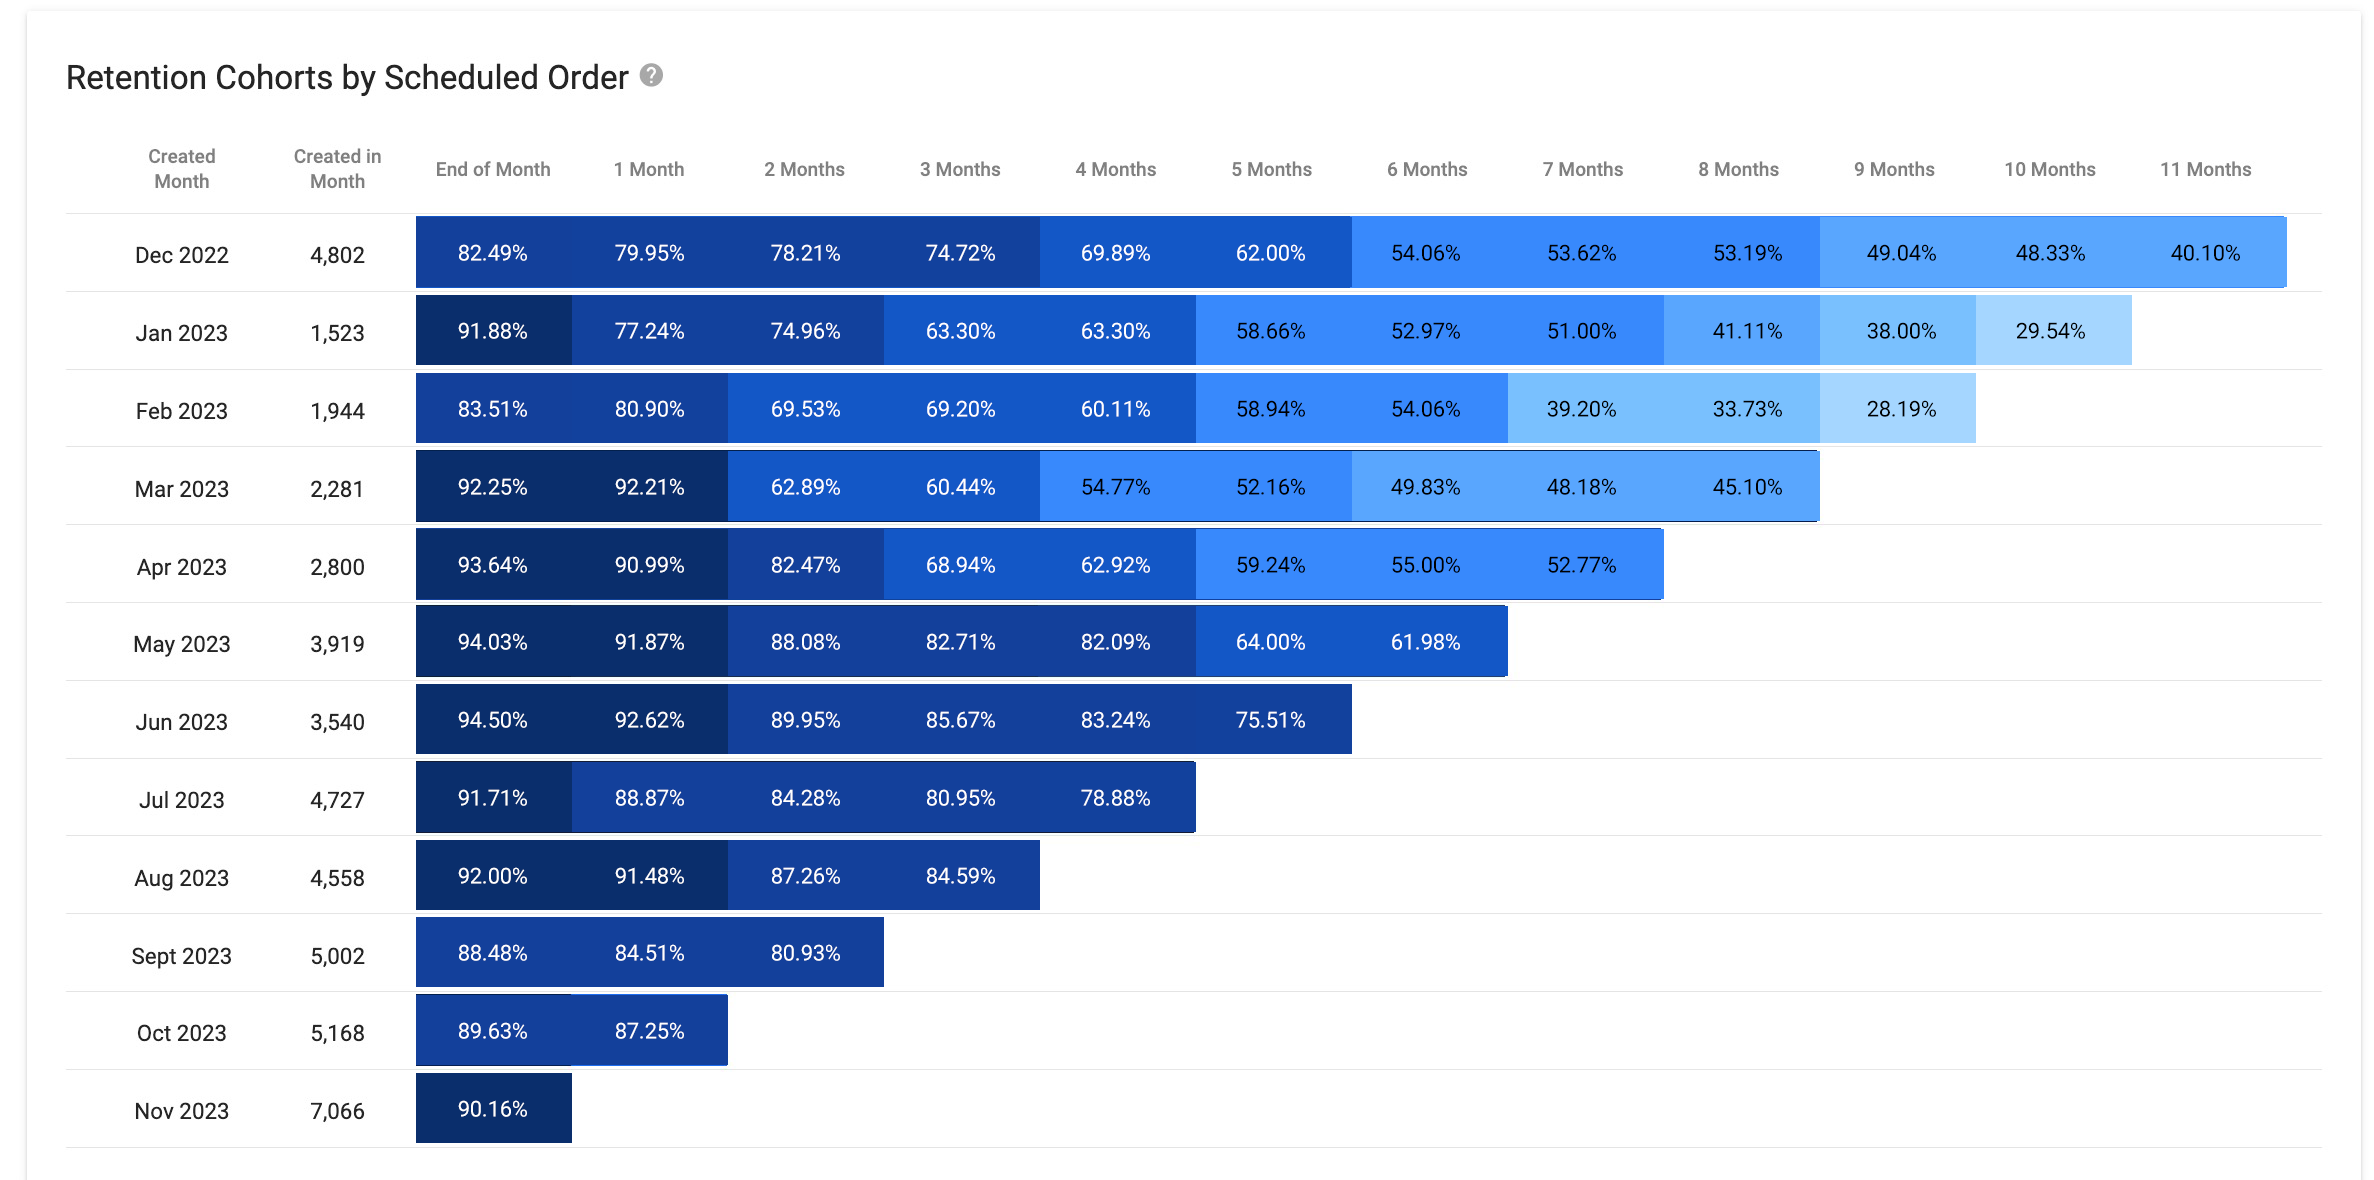
Retention Cohorts by Scheduled Orders
This chart shows what percentage of Scheduled Orders are Active versus Deleted after X months of being created in order to provide insight into your Scheduled Order churn and retention performance over a 12-month period.
Learn more about the Cohort Report here!
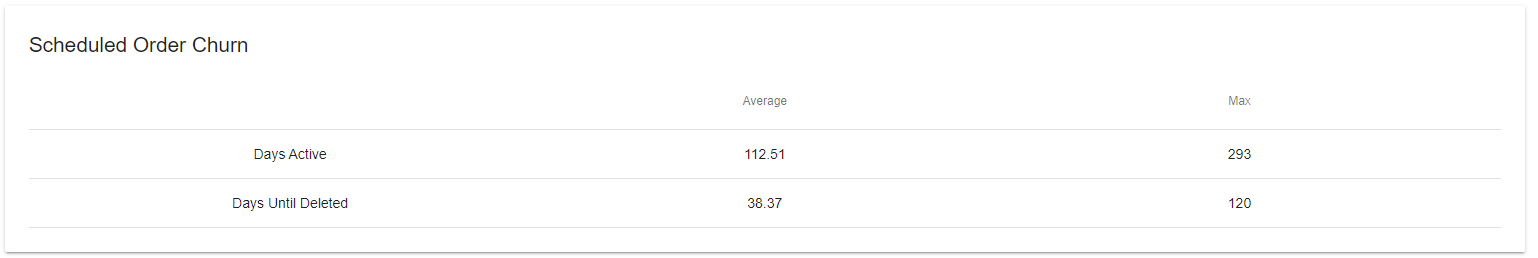
Scheduled Order Churn:
- Days Active
- The average number of days between the Scheduled Orders creation date and today's date if the Scheduled Order is in an Active Status
- Days Until Deleted
- The average number of days after a Scheduled Order is created that it is Deleted (or Canceled).
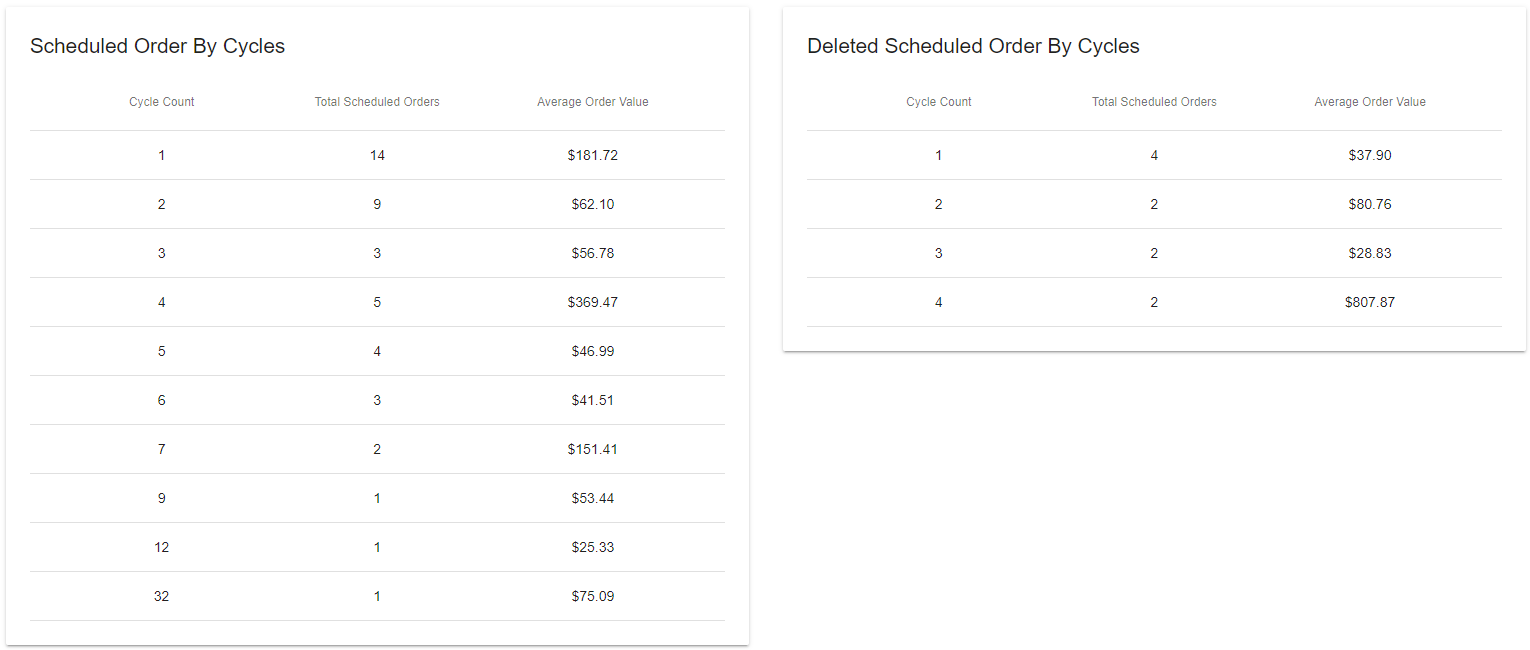
Scheduled Order By Cycles
- Cycle Count
- The number of times a Scheduled Order is successfully processed (cycled)
- Total Scheduled Orders
- The total number of Scheduled Orders (regardless of status) that have been processed X number of times
- Average Order Values
- The average of the Scheduled Order Subtotals that have been processed X number of times
Deleted Scheduled Orders By Cycles
- Cycle Count
- The number of times a Scheduled Order is successfully processed (cycled)
- Total Scheduled Orders
- The total number of Scheduled Orders (that are currently in a Deleted Status) processed X number of times before being Deleted.
- Average Order Values
- The average of the Scheduled Order Subtotals that have been processed X number of times and are Deleted
Updated about 2 months ago
Did this page help you?